Step 1: Characterise Rockmass and Compile Test Results
- Validate the logging data and evaluate the information statistically to determine a suitable GSI range and other information, such as Field Estimated Strength, to help guide the determination of a suitable UCS range.
- Compile all test results into a single database consisting of the relevant sample information, test results for each sample, and the following additional information:
- Bedding/Foliation angle (If applicable) of the sample tested,
- Pre-test and Post-test sample photos,
- Failure mode and,
- Test validity.
Step 2: Review Test Validity and Failure Mode for Peak Strength
- As part of the structural and lithological review, investigate the occurrence of anisotropic conditions and identify anisotropic lithological units.
- Cavroc’s proprietary IUCM constitutive model accounts for anisotropic conditions. Therefore, to develop suitable parameters, it is essential to review all samples for failure modes to identify anisotropic strength and bi-modal failure.
- Weak Orientation – Failure along inherent weakness planes or rock mass fabric.
- Strong Orientation - Failure through the rock matrix.
- Review each test certificate for validity and exclude all samples with invalid failure mode. A general guide to determining test validity is shown below:
- Valid Test – Tests that have failed through the rock matrix or ubiquitous fabric,
- Invalid Test – Tests that have failed through isolated defects, tests on poor samples etc.

Figure 1 General Failure Mechanisms of Rock Under Compression
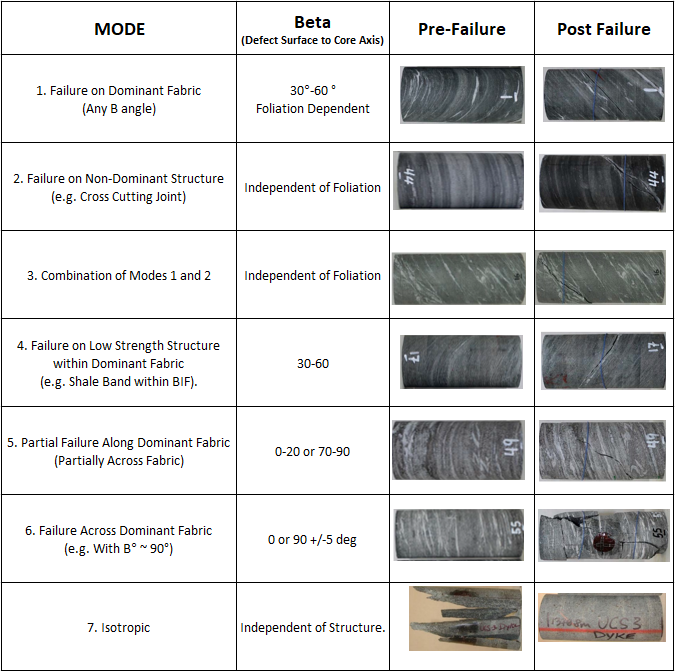
Review the pre and post-failure photos of the samples and categorize each sample into a failure class (see table below) based on the failure mode and the defect surface’s angle to the core axis (Beta), as shown below.

Figure 2 Categories of Failure Mode
The same procedure of categorizing samples based on their failure class also applies to tensile strength tests.
Step 3: Hoek-Brown Failure Envelope
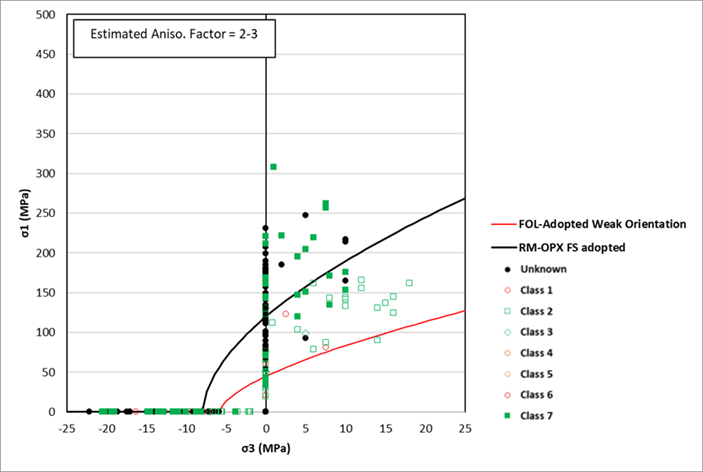
Populate the valid test results in the Principal Stress space as shown below. It is recommended that the values be plotted based on the failure category, as shown below.

Figure 3 Example of lab test results in Principal Stress space categorized by failure class.
Determine the weak strength orientation by fitting an HB failure criterion best-fit curve through the valid test results categorized as failure dependent on inherent anisotropy (red curve in the above example). Failure categories 1, 5 and 6 are usually used to determine the weak orientation strength.
Similarly, determine the strong orientation strength by fitting an HB best-fit curve through the valid test results categorized as class 7 (Intact or axial).
Ensure at least five nos. intact triaxial tests at regular confining stress intervals are available for an accurate fit and reasonable estimate of the intact rock constant (mi).
Calculate the anisotropy factor for the rock mass using the below equation.

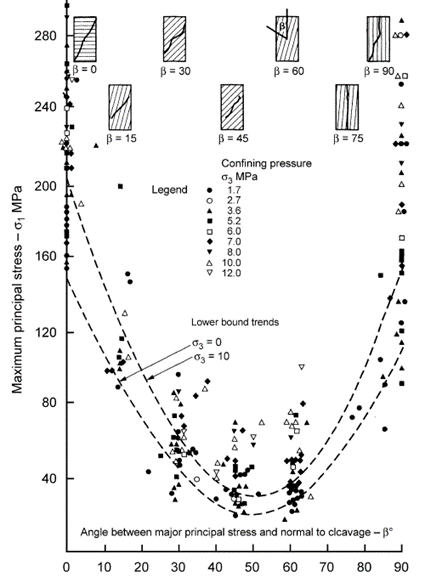
As shown below, the anisotropy factor can be verified by producing an axis beta angle vs UCS plot.

Figure 4 Influence of loading direction on triaxial strength (tested by Brown et al., 1977)