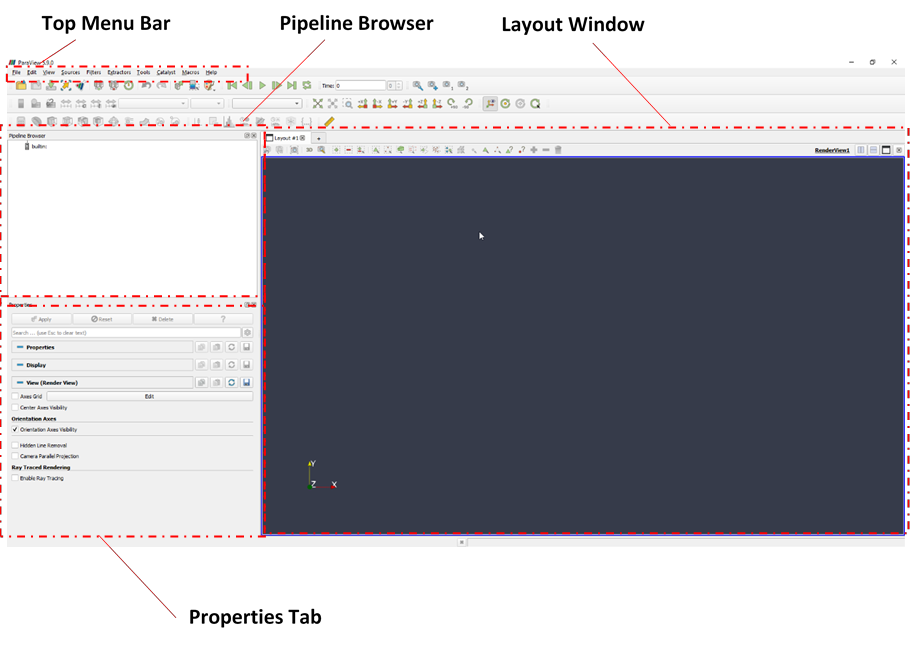
There are few sections that you should become immediately familiar with as we will refer to them frequently throughout this document. They are:
Top Menu Bar
This is where you will find the settings related to the running of the program. File input and output settings can be found here, as well as the settings that enable/disable varying screens associated with the program.
Pipeline Browser
This is where you drag and drop the files and data you wish to work with. ParaView works by applying filters to the data. ParaView does not alter the data directly, rather it runs filters to generate new data sets and works with them. Different filters can be used together, and the filters follow a hierarchical structure in the sequence which they are applied to the dataset.
Layout Window
The Layout window is the window where you will see the model you are working with. This is most often a 3D representation of the data being worked with. However additional layouts can be added that take different forms such as line graphs, histograms, spreadsheets, and other views. You can add additional layouts and order the windows as you wish. This will be covered later in the document.
Properties Tab
This is where all the settings regarding the filter you have currently selected will be displayed. Please note, that the settings in this window will vary based on what is currently highlighted in the pipeline browser.
