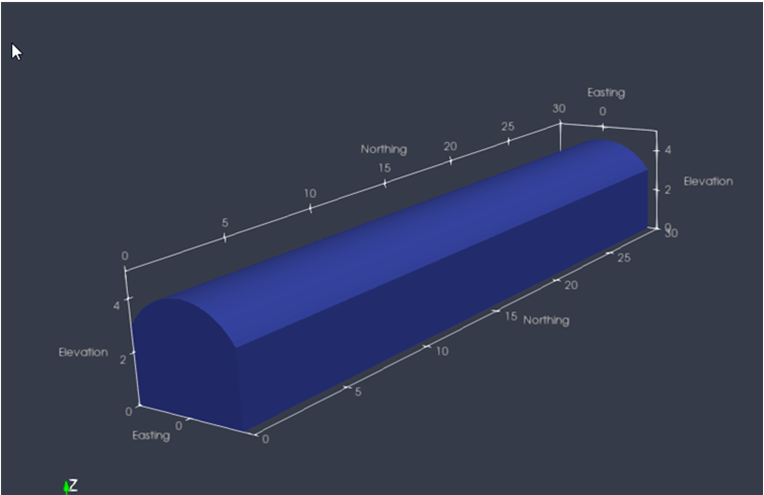
1. Viewing Geometry
Begin by dragging and dropping an example stope file into the pipeline browser
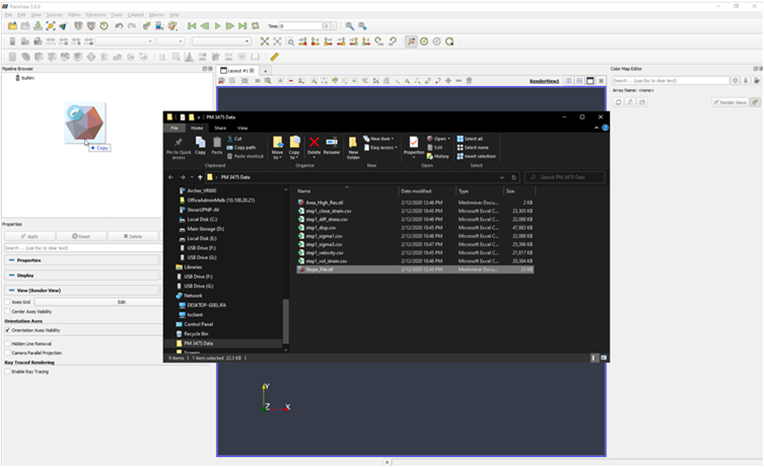
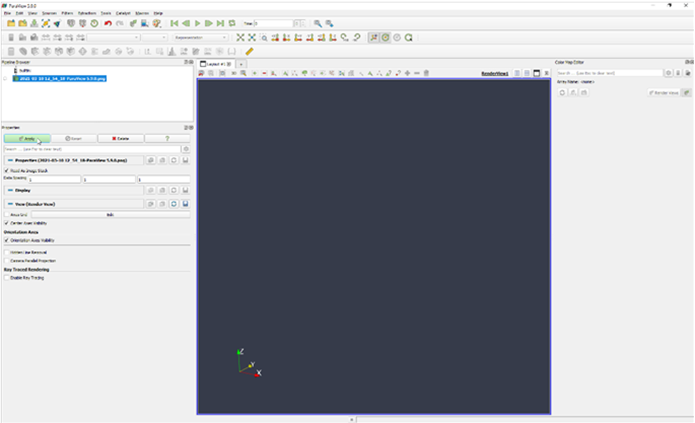
You will then need to click the apply button located in the properties tab as shown below. Take a mental note of the apply button as it is very important. If something is not displaying in the layout tab, most often it is because the filter has not been applied yet due to this button not being pushed.
The stl file will be displayed in the layout window. In the properties tab, there is an option that allows you to toggle Parallel Projection. In the properties tab, under the heading styling, the opacity of the object can be set. Try setting this value to 0.2 by altering the adjacent slider or setting the value to0.2
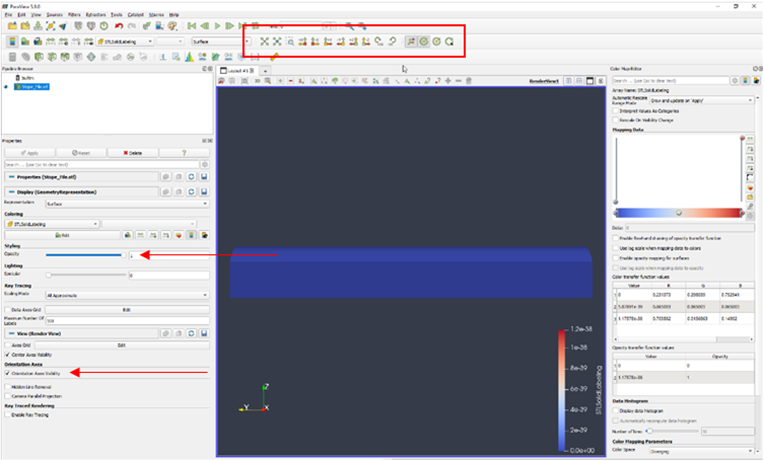
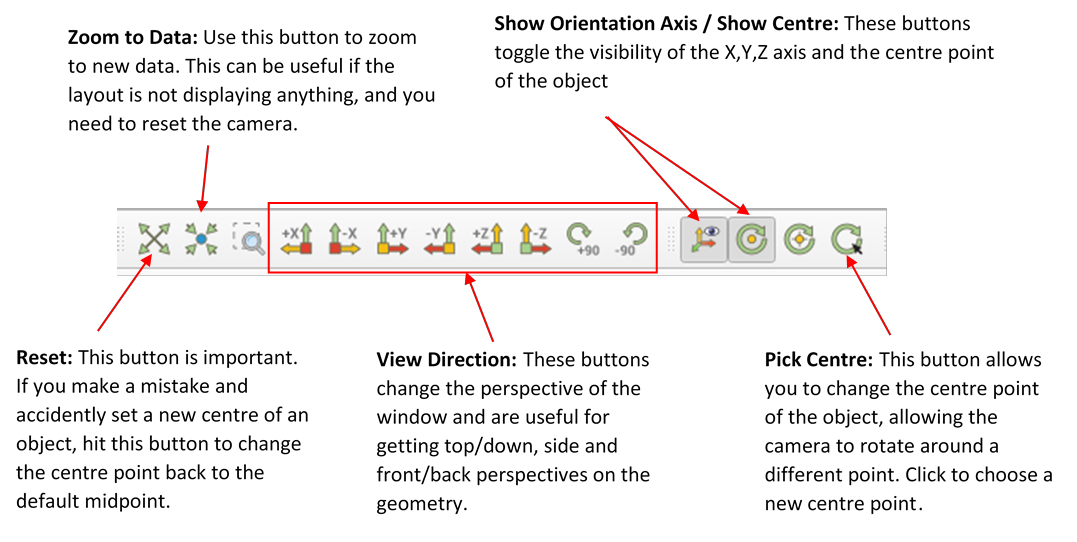
For now, observe the toolbar highlighted in the red box in the image above. This toolbar contains the basic view commands forthe program.
2. Setting the Camera:
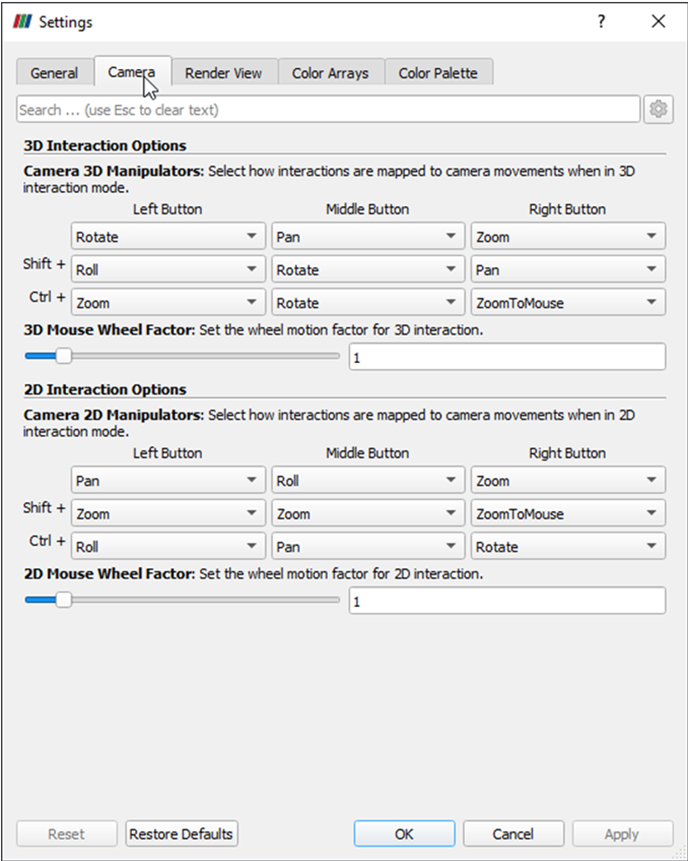
There are other ways to change the camera position as detailed below:
Rotate about centre: Left Click (hold).
Rotate whole object: Shift (hold) + Left Click.
Zoom: Right Click (hold), Mouse Wheel.
Pan Object: Shift (hold) + Right Click, Middle Button.
All of these camera settings can be changed by selecting edit -> settings -> camera in the top menu bar.
3. Using the Ruler and number formatting:
The ruler is a useful tool for evaluating information. To enable it, locate the ruler button as shown below.
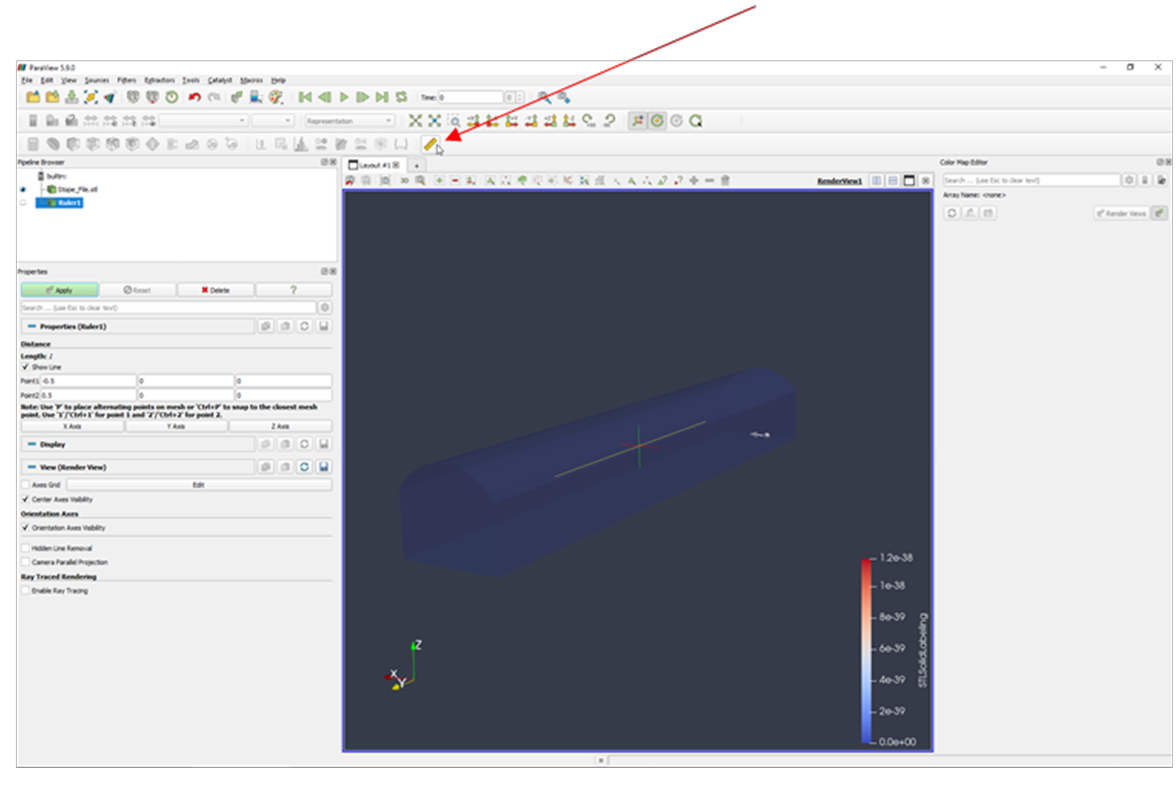
You can change the position of the start and end of the ruler by entering numbers manually into the distance field, under properties. However, a much faster way is to use Ctrl+1 for the position of the point 1 and Ctrl+2 for point 2. The points will automatically snap to the nearest point available.
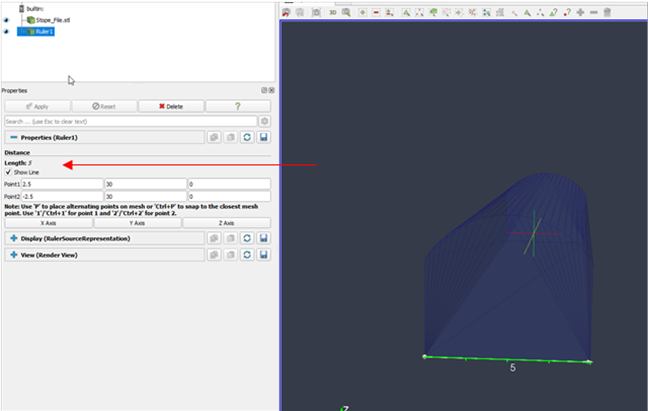
The next thing to consider is the format of the line. The Label Format bar uses the printf format for describing how data will be displayed. More information on the printf function for the c++ library can be found here.
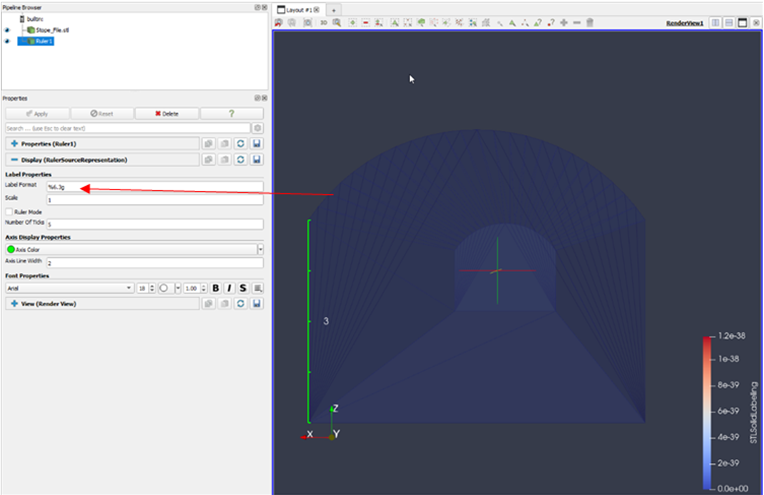
4. Number Formatting
For example, consider the number format %1.5f
% -Tells the program we are talking about number formats.
1 –Tells the program the spacing from the left-hand side, in this case 1 character.
.5 –Tells the program we want a number with 5 significant figures.
f –Uses floating point precision
e –Uses scientific notation

If the format is change to %1.1fm then the measurement label becomes the following. 5.0m as shown below.

5. Legend Formating:
This number format extends to the format of all axis and legends. For example, highlight the Stope File, in the properties tab, locate the display tab. Under the colouring tab, there is a coloured vertical bar with a letter “e” on it. This button controls the format of the axis of whatever is selected. In this case, because we selected the stope file first, we will be changing the axis called “STLSolidLabelling”.
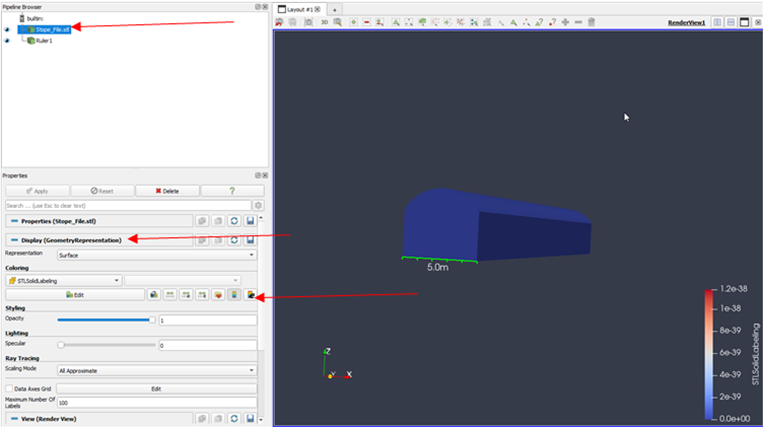
Selecting this button will open the following dialogue box. If you wish to change from scientific format to a regular number format, change this string from “%-#6.1e” to “%-#6.1f”. This will change the format to a 1 decimal place, floating point number. In the case of STLSolidLabelling, this is not particularly useful, however when filters are applied that have information related to what you want to visualise, this will be more useful.

6. Axis Grid:
The axis grid is a useful tool for evaluating scale in the model. The axes grid information can be found in the Properties window under View. See image below for example.
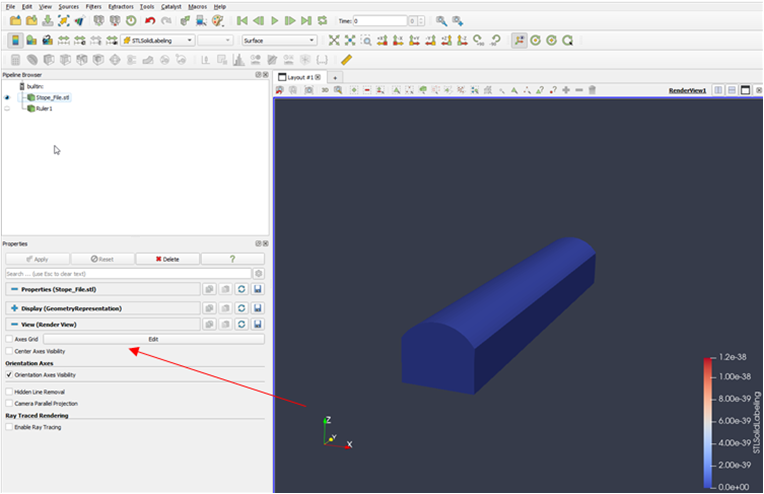
Clicking the edit button will bring up the following dialogue box.
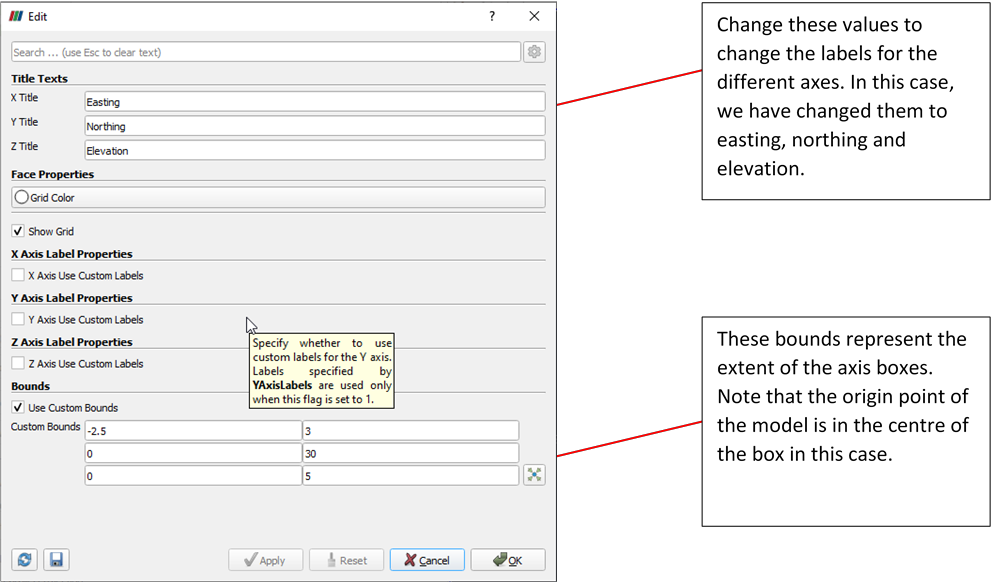
Making the above changes creates a grid around the object as per the following.
