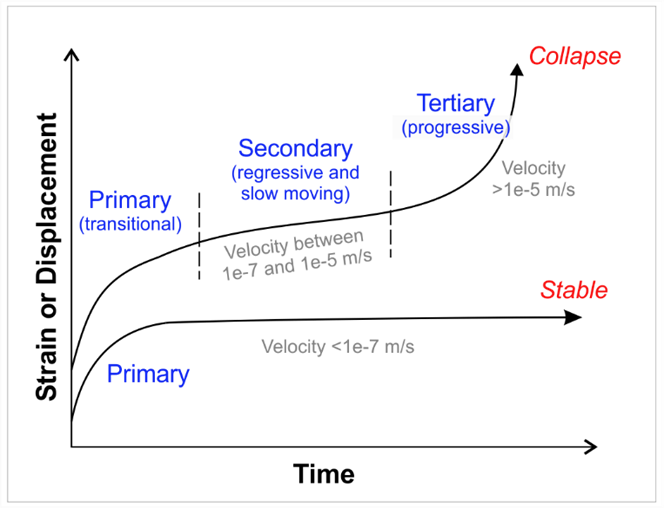
Lorig and Varona state that the behaviour of the numerical system must be interpreted and results from models are interpreted in much the same way as prism data is interpreted. FLAC3D records displacements and velocities at nominated points within the rock mass. During the analysis, the recorded values can be examined to see if they are increasing, remaining steady, or decreasing. Increasing displacements and velocities indicate an unstable situation; steady displacements and decreasing velocities indicate a stable situation.
Lorig and Varona have found that, for slope stability analysis, velocities below approximately 1e-6 indicate stability in FLAC3D, and velocities above 1e-5 indicate instability.
Velocities between the above two thresholds (after model equilibrium is achieved) can be considered as transitionally stable or slow-moving slope condition. The velocity criteria are summarised below.
It is stressed that this velocity is in units of metres per modelling timestep and is not correlated with real time.

Yield states indicate the failure mode (shear or tensile failure) associated with each FLAC3D zone. They are useful indicators to understand if failure is driven by tensile, shear or jointing. Yield states are also useful in identifying active-passive failure mechanisms and are able to show the transition between mechanisms and identify failure propagation. It needs to be noted that yield states on their own do not necessarily indicate large-scale failure and need to be considered in conjunction with other methods.