General Overview:
- Load the numerical modelling zone outputs (.csv files) to Paraview
- Filter the zone outputs based on the volumetric strain (adjust the threshold accordingly)
- Load the geometry files (.stl files)
- Create pipeline filters for volumetric strain and closure strain
Reminder that you would need to adjust the bounding box and color map value range accordingly to suit the visualisation.
Automated Plotting
I have also made a python script macro Strain_Plot.py to automate the plotting process (Step 3 and Step 4). Further modifications may be required after the plots are produced to improve the visualization.
Step 1 and Step 2 is not automated as it is more appropriate to filter the output dataset on a case by case basis.
Please refer to the .pdf for the detailed steps on how to run the macro here. This guide also shows how to produce these plots manually.
You can find all the necessary files (color map .json files, and python script) in OneDrive link here.
Troubleshooting when running the macro
You may encounter issue on the first run, and it is most likely due to the following:
- The pipeline name (Filtered_data.csv and Step1.stl) not named correctly. The macro is case sensitive to these pipeline name as it is hard-coded.

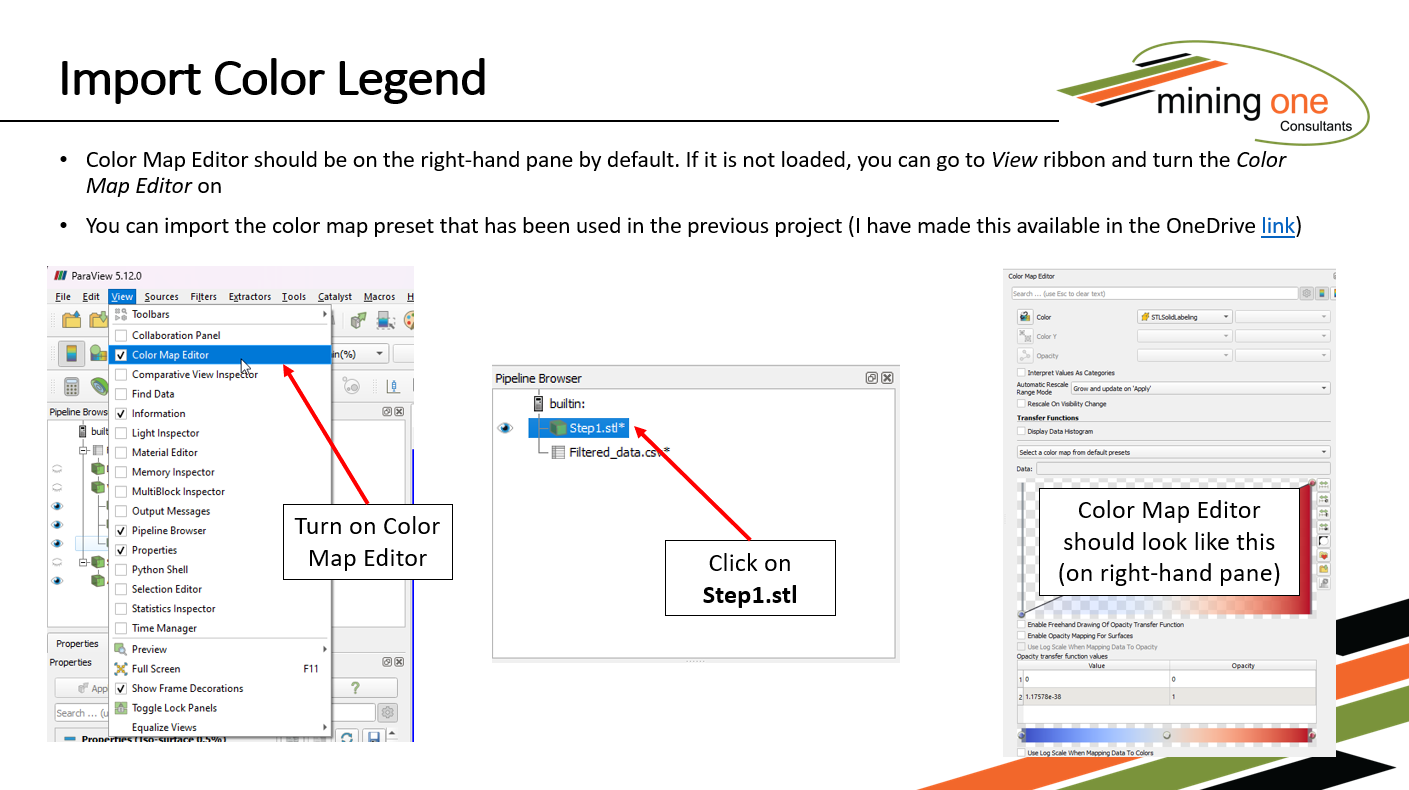
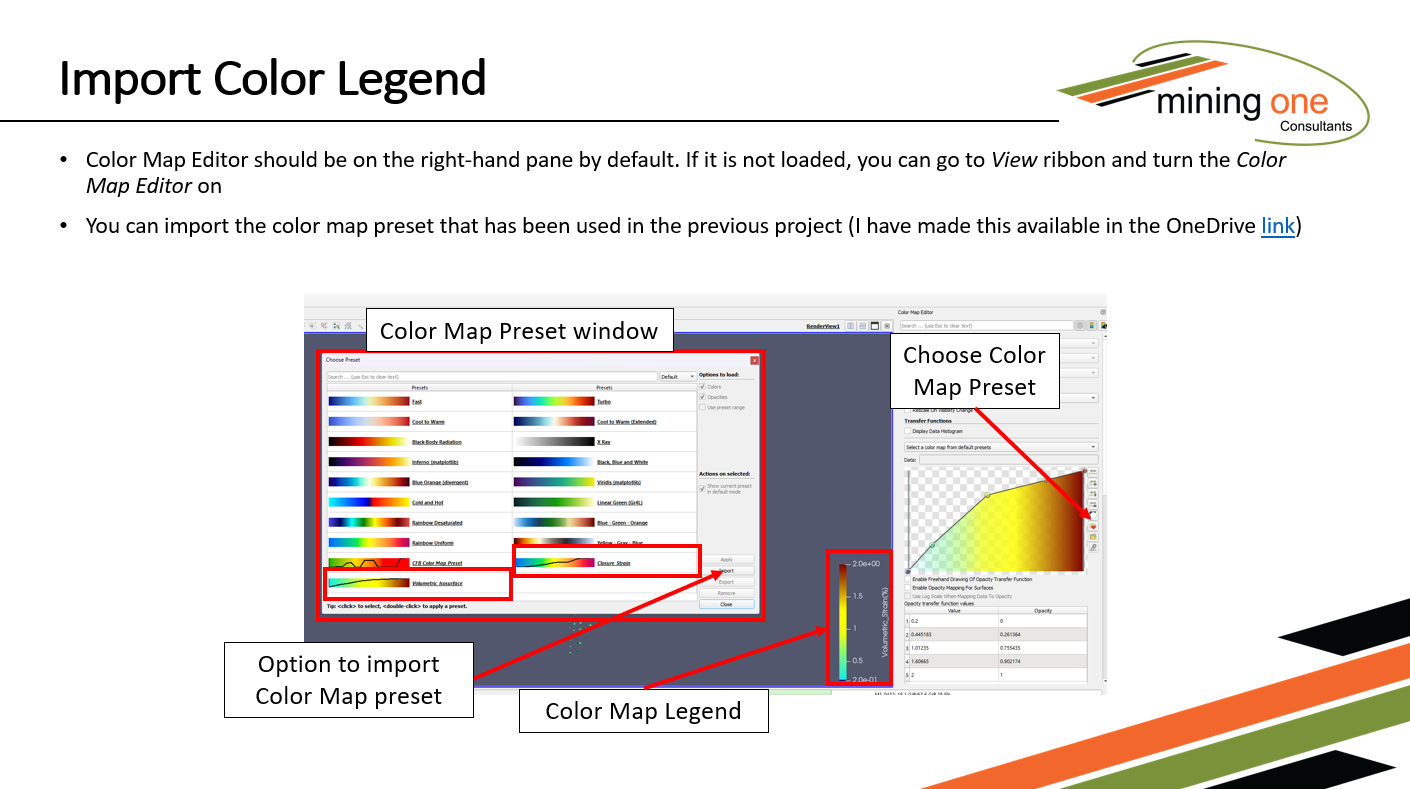
- Color Map files (.json) cannot be found. You can solve this by importing the color map files in Paraview. Simply go to the Color Map Editor and Import the color map files (explained in Slide 22-23 of the guide) before running the macro. Once color map is loaded, the .json error should dissapear.
Slide 22:

Slide 23:
