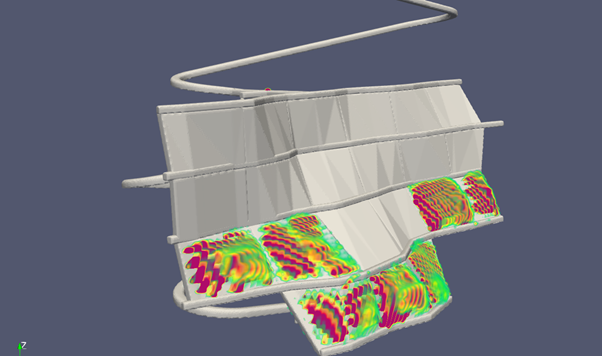
Once you are comfortable importing/plotting csv and vtk results files in paraview, the following guide can be used to import multiple results files, to allow use of the paraview animation tools switch between results.
Paraview by default is set up to view models with multiple stages, which makes things easier for reviewing StopeX outputs.
Fist we will import the model step geometries, got File -> Open
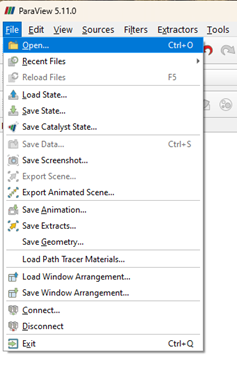
Paraview will automatically identify the sequential numbering of the step files, and allow you to import them all in one click. Notice the drop down buttons for the sequential file groups:
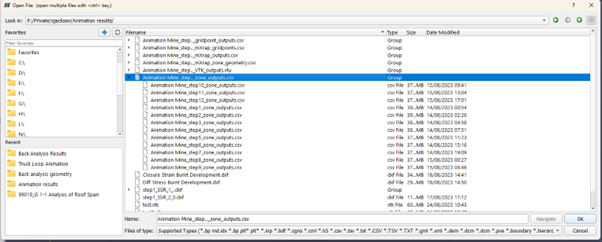
Open the group header for the step stl files and click ‘OK’
A single item will appear in the pipeline browser, click the apply button and step 1 will now be visible.
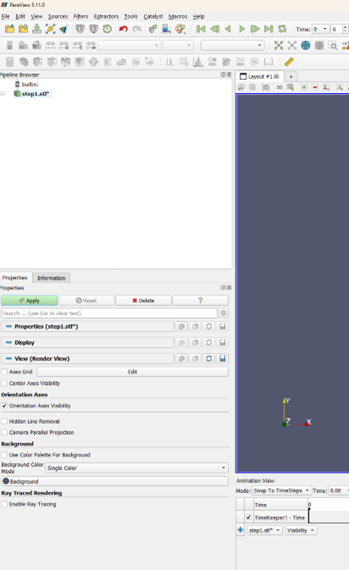
For the step geometries, we want to view multiple at the same time, so right click the item in the pipeline browser: Add Filter -> Alphabetical -> Group Timesteps
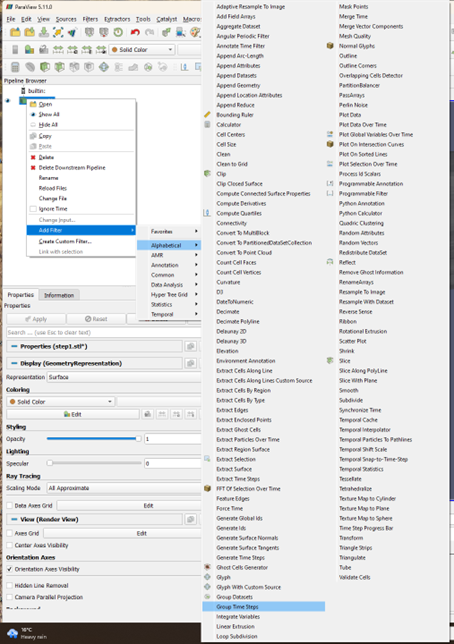
Then click apply again.
Now you will see all the timesteps in the viewport. You can adjust the colours of each step, or change the colouring methodology in the drop down to assign a single colour
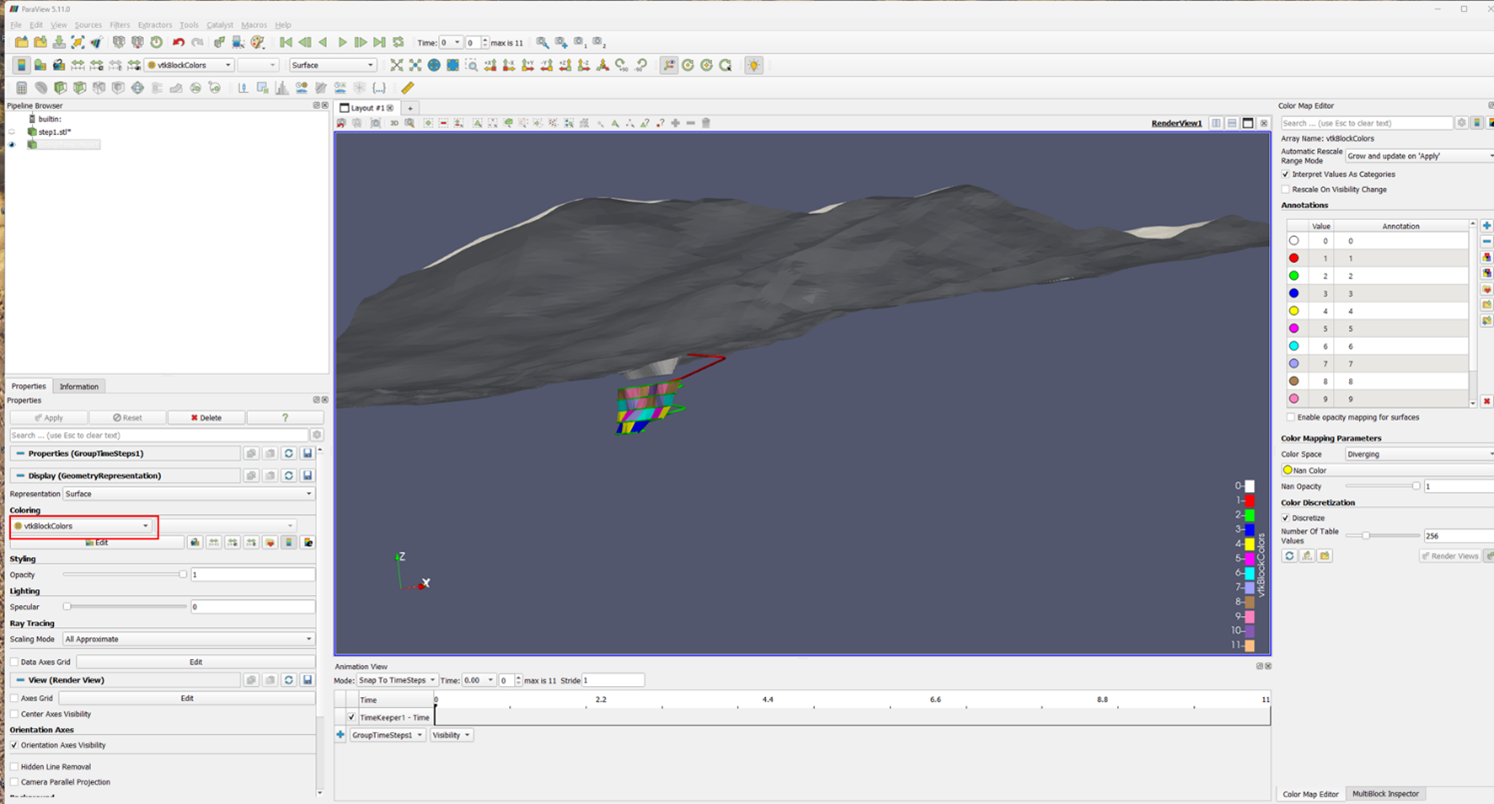
To allow us to turn steps on and off we use the multiblock inspector
Click View -> Multiblock Inspector
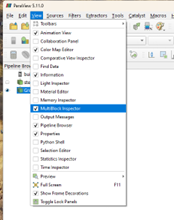
On the right side of the screen, the inspector panel will be available - checking and unchecking each item toggles visibility.
Next up we will add the results files as a time series.
Go to file -> open
Then select the vtk or csv results file group.
Then click ‘Apply’ again.
If you are using the vtk files, the mesh will now be visible on screen, if you are using csv’s there is an additional step required.
CSV import additional Step
Right Click on the csv file in the pipeline browser on the left of your screen
Go to: Add Filter>Alphabetical>Table To Points
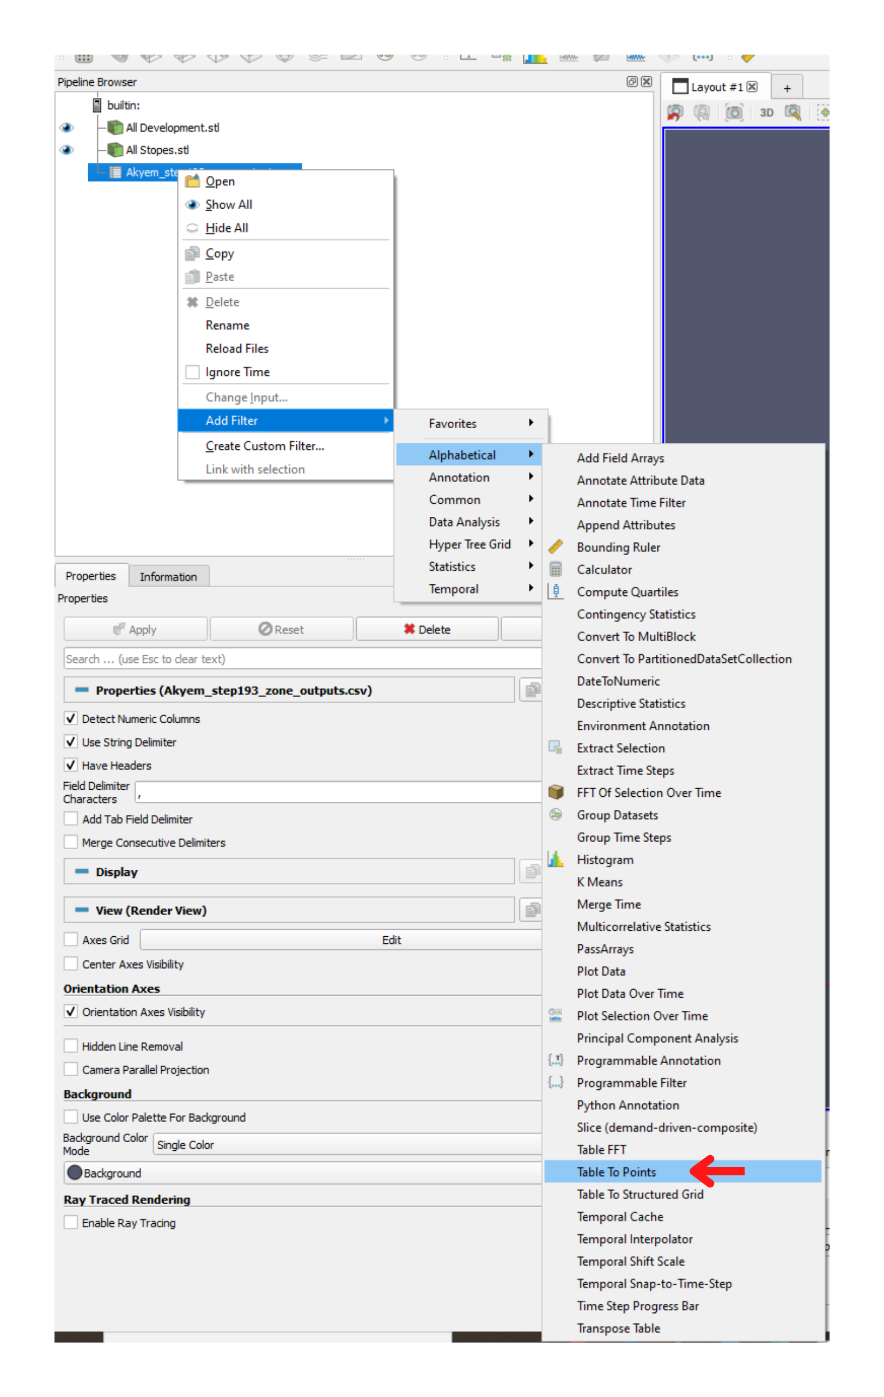
Next set the columns in the table that are the x, y, and z attributes, then click ‘Apply’
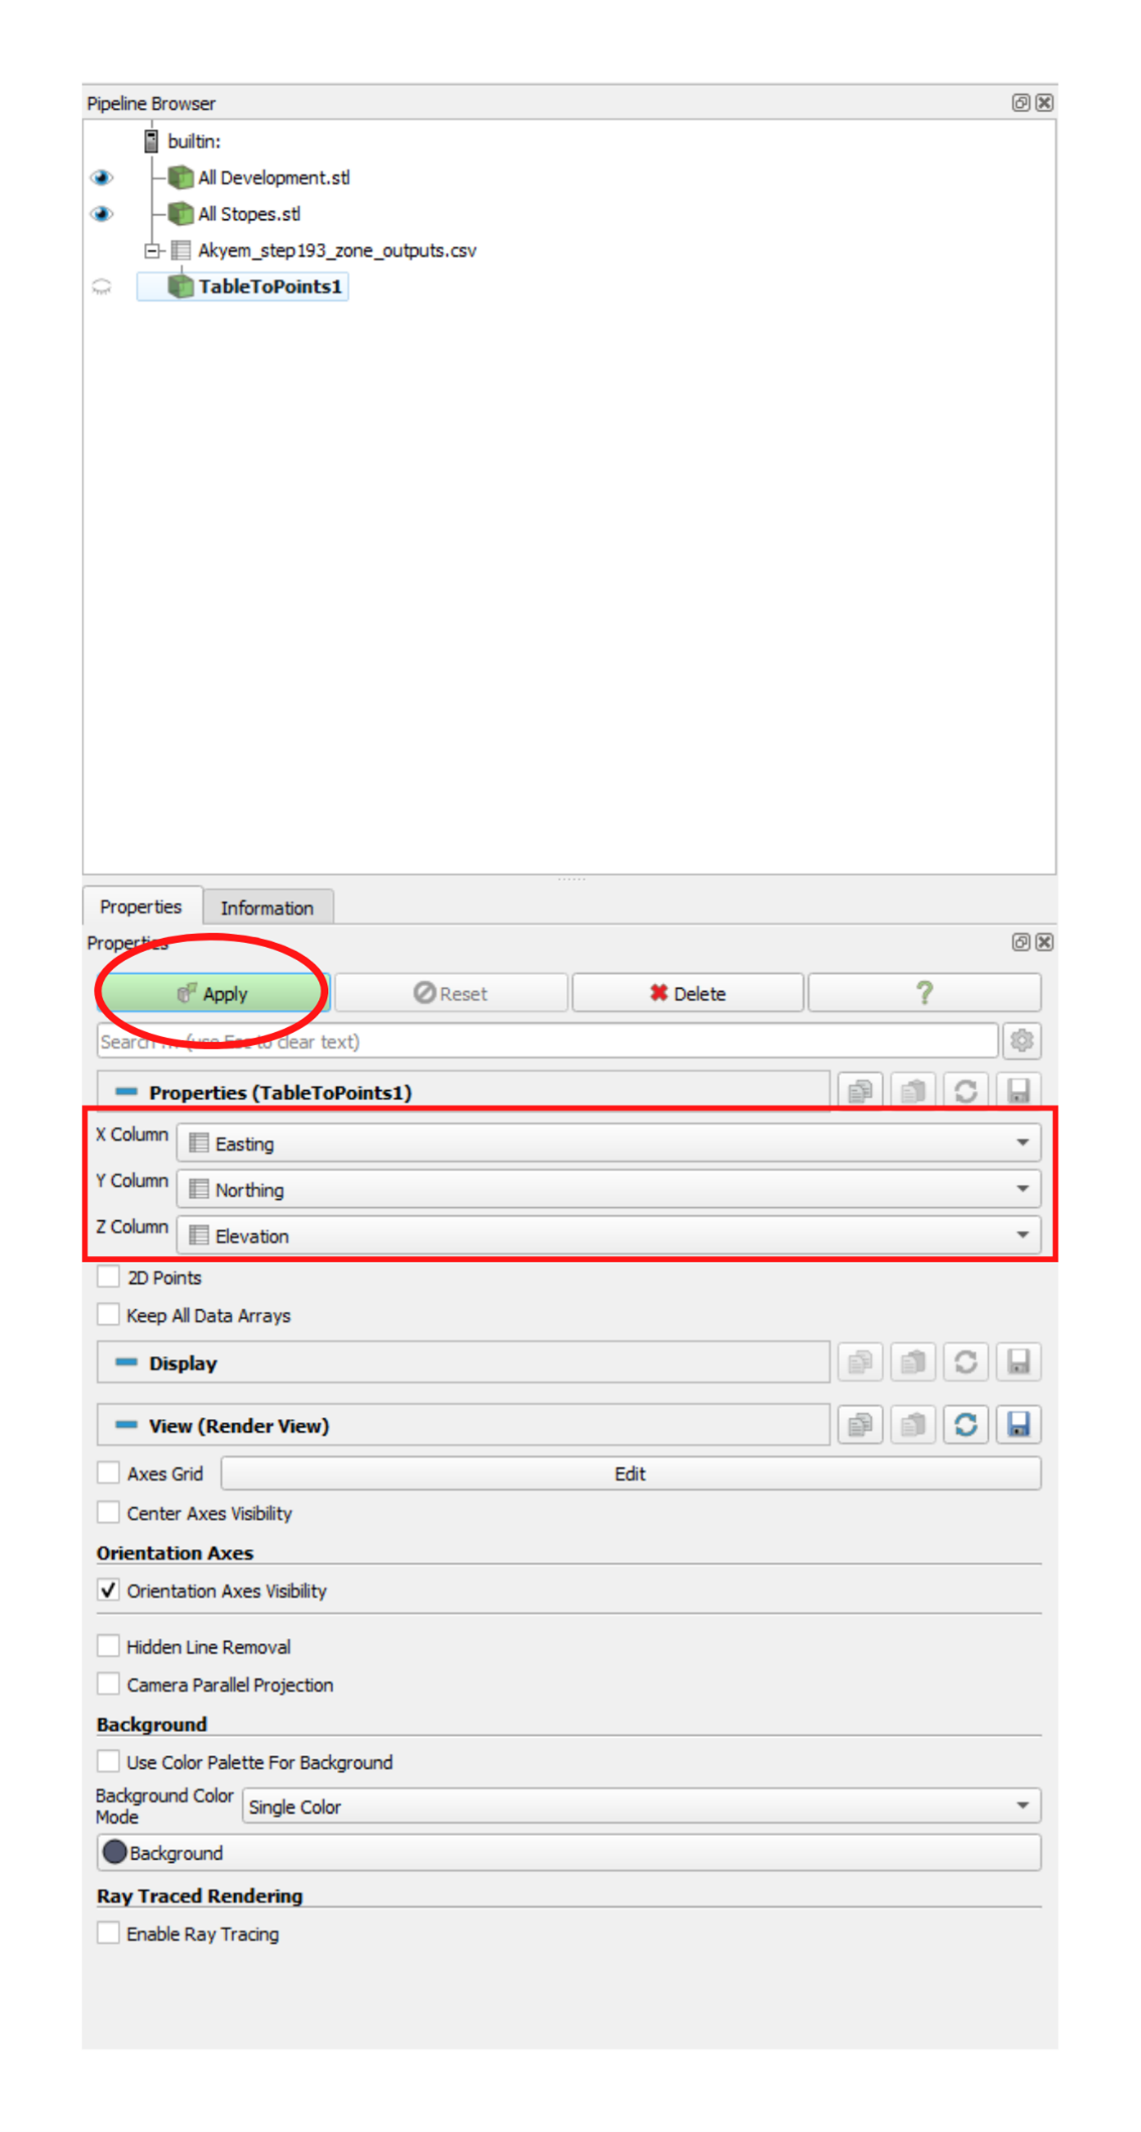
The Points will now be visible in the main window.
To contour these points simply as they have been imported, follow this cavroc forum guide: https://forum.cavroc.com/d/51-plotting-results-over-a-full-model-using-paraview
Using the above methodology allows you to plot data ‘as-is’ although some additional options are available to interpolate data to create smoother plots.
As we have chosen to import the group of results, we can display each model step using the animation controls.

Point-Volume interpolation
The point volume interpolator creates a structured grid of points with equal spacing, giving access to more plotting tools.
Right click the ‘table to points’ item add a new filter and select ‘Point Volume Interpolator
You can set a filter box to an area of interest to assist with performance, or run over the whole model if necessary. Set the refinement mode to ‘Use cell-size’ and define the spacing for the regular grid, then click apply.
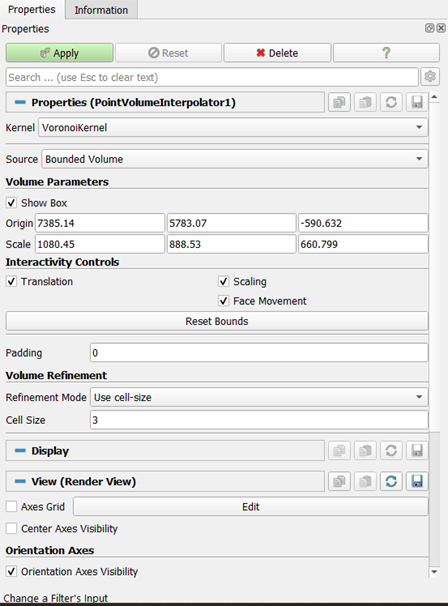
Once processed, you can plot point/gaussian as before or you can add further filters such as ‘contour’ to build nested iso-surfaces for a series of values. You can also use the NVIDIA IndeX plugin as demonstrated below.
NVIDIA IndeX
With Paraview version 5.11 or later, an nvidia plugin is available that provides additional plotting options for big data sets.
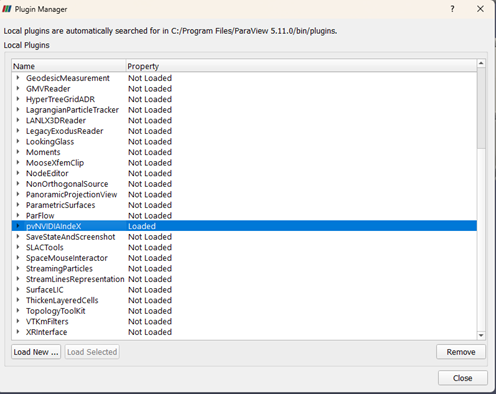
First you must enable the plugin:
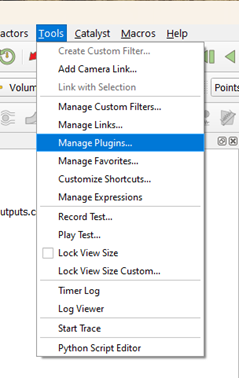
Go to Tools -> manage plugins
Find ‘pvNVIDIAIndeX’ in the list, select it and click ‘load selected’
Now, in the ‘display representation’ drop box of your ‘point volume interpolator’ item there will be an additional option
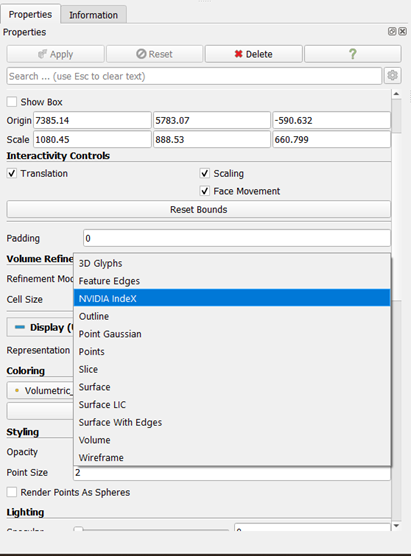
Select NVIDIA IndeX, and assign the colour ramp, and opacity mapping as before: in this case there is a simple 0-2% volumetric strain colour ramp is applied with opacity mapping turned on:
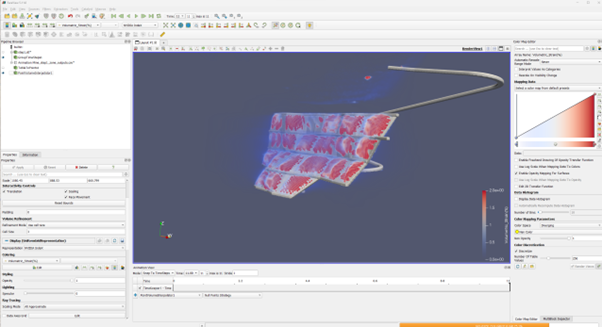
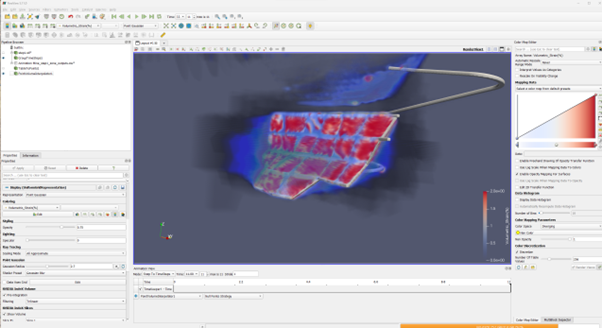
You can see the difference vs a gaussian blur with the same contouring here:
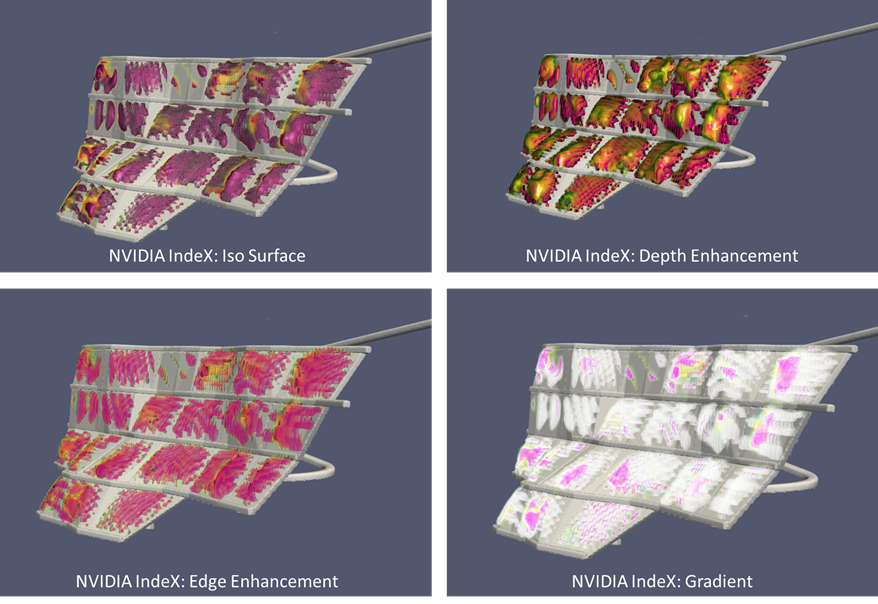
There are some additional visualisation options that can be used to enhance the image further.

Difference Between Steps
A filter is available to look at changes in properties between model steps.
Right click on one of the results plot items and add a new filter: ‘TemporalArrayOperator’
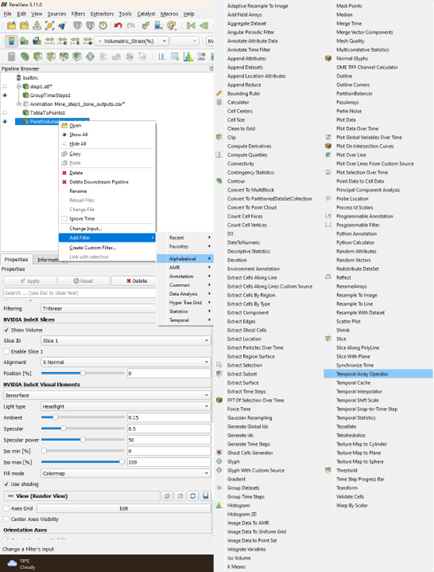
In the properties pane choose the two steps you want to look at the difference between, in this case I’m looking at the change in volumetric strain between step 5 and step 11, then click apply:
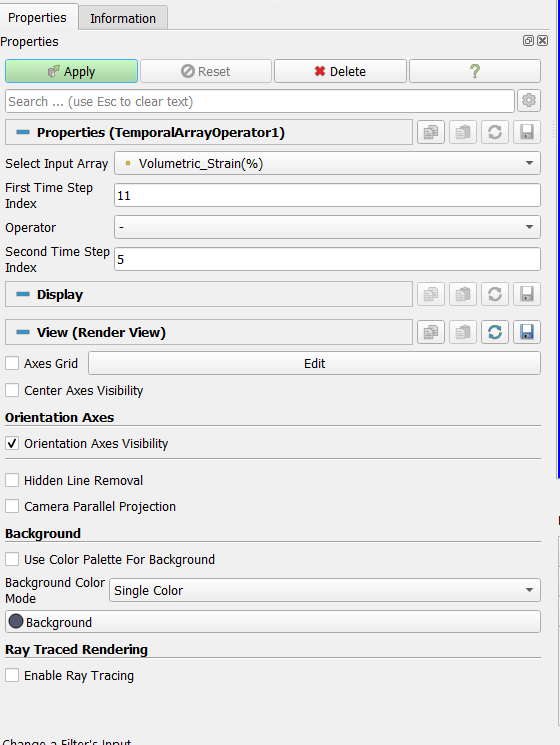
Once processed, the Volumetric Strain will include the difference between the two steps:
